Camera Based Water Level Measurement
Published on September 8, 2011 by TIS Marketing.
US Geological Survey (USGS) and US Forest Service hydrologists, and municipal water resource managers utilize automatic water level measurement sensors to track water levels in lakes, rivers, and other bodies of water around the United States. They generally use float, pressure transducer, or ultrasonic transmitter based gauges. Water level measurements (a height in feet or meters) with timestamp and location data are transmitted to a database server via cellphone or satellite.
At times it is difficult or impossible to distinguish between hydrologic events and equipment malfunctions from the data sent to the server. For example, debris or sediment buildup may affect water level measurement. A technician must visit the remote systems, sometimes at great expense, to know what caused anomalous measurements. The uncertainty and expense of such anomalies can be mitigated with a camera based system that transmits an image of the scene along with the water level measurement, timestamp, and location.
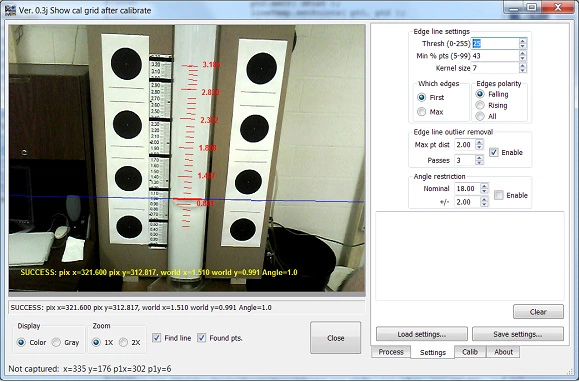
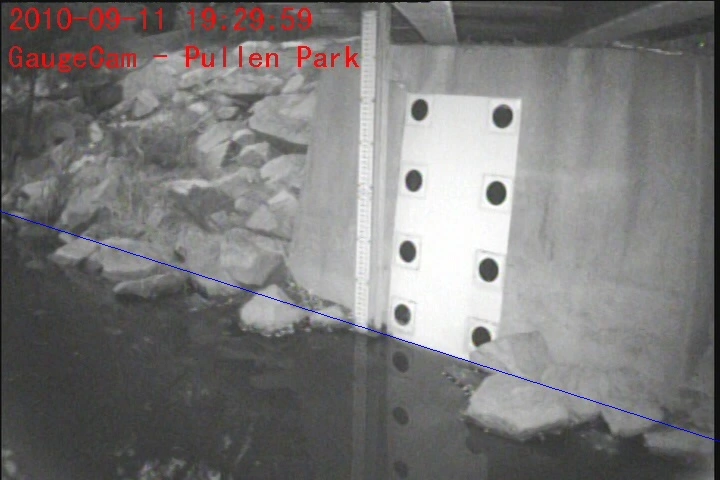
Figure 1.
Dr. François Birgand of the Biological and Agricultural Engineering (BAE) Department at North Carolina State University approached GaugeCam.com to help him develop just such a camera-based water level measurement system. GaugeCam.com develops systems that perform machine vision and image processing tasks and presents the results in real-time on the web. The entire scope of the project was to develop an inexpensive, camera-based system to measure and track the level of water in streams, lakes, rivers, ponds, and even the ocean.
First though, Dr. Birgand wanted to perform basic feasibility testing to determine whether it was possible to accurately measure water level in a controlled environment. He and Troy Gilmore, his research assistant, proposed a three phase feasibility study, only moving on to a new phase after the previous one was completed successfully:
-
Phase One: A one week study to determine whether a camera could track the level of water in a bucket or pan in a lab. Do not try to convert the the water level position from the pixel position of the line in the image to the real world coordinates measured in feet/meters required by the USGS.
-
Phase Two: Build a test setup in the lab that provides more variability in the image (lighting and shadow variation, background variation, illumination with IR lighting required for night measurements, etc.). Do the calibration to perform the pixel to world coordinate conversion required to report the water level in feet/meters. Perform studies to measure the repeatability and accuracy of the system under a variety of conditions.
-
Phase Three: Place a camera beside the USGS water level measurement station in Pullen Park on the NCSU campus to determine whether the measurements taken by the camera-based system tracked with the measurements taken by the USGS.
Dr. Birgand was ready to invest additional resources to take the water measurement system into the wild only if the all phases of the feasibility study were successful.
Phase One - Basic Feasibility
The entire purpose of the first phase feasibility study was to determine whether it was possible to find the water edge robustly under relatively good conditions. GaugeCam.com selected a VGA color camera from The Imaging Source to perform the study. This camera was selected because of its durability, broad capabilities (trigger input, strobe output, USB connectivity, etc), low cost, and drivers available for use with both Microsoft Windows® and Linux. The suction cup camera mount that came as part of the The Imaging Source development kit provided a way to fix the camera in a position to watch the water rise in a bread pan. GaugeCam selected a line based edge detection algorithm to look for edge points on a (relatively) horizontal water line and fit the points to a line. This edge detection scheme was both effective and fast at finding the water edge. Figure 2 is a screenshot of one of the measurements. You can see a video of measurements in close to real-time here.
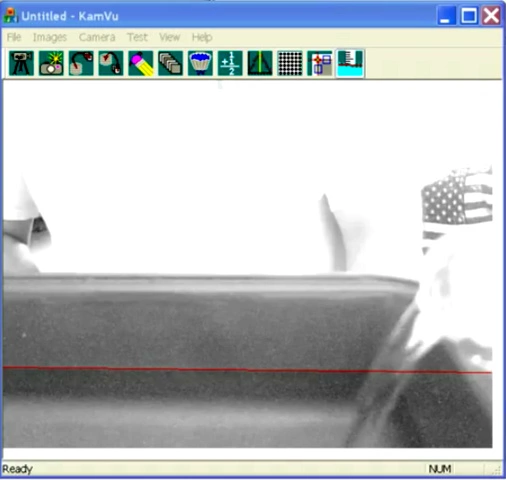
Figure 2.
Phase Two - Water Level Measurement Repeatability and Accuracy in the Lab
The second phase required several months of work. Troy built an apparatus in the BAE lab at NCSU that consists of a clear Plexiglas tube on a table with a water reservoir beneath the table. There is a siphon hose that runs from the top of the tube down to the water reservoir. A pump continuously fills the tube with water at a fairly slow rate. The water enters a siphon hose when the tube is almost full so that the water in the tube is rapidly siphoned back to the reservoir even as the pump continues to fill the tube. The vision system measures the level of the water as it moves up and down in the tube. A replaceable background is centered in the middle of the tube to emulate the appearance of the water line against a flat surface as it would most frequently appear in the wild. Such backgrounds included the concrete and painted metal construction material used in bridges where many of the USGS stations are located. You can see a time-lapse video of the The Imaging Source camera connected to one of the lab computers detecting the water level as it moves up and down in the tube here. A later version of the setup is shown in Figure 1.
As was mentioned previously, a line based edge detection algorithm is used to find the waters edge in the tube. A series of vertical lines in the area inside the tube are evaluated to determine the position of the waters edge. The edge point positions are defined by their pixel row and column positions within the image. The equation for the water line is calculated by a linear regression fit of the edge points. Figure 3. is a diagram from a detailed description of how the line edge detection works. That detailed description can be found here. The actual code for line based edge detection and its use in real world application will be the subject of a later article.
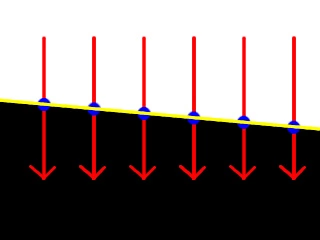
Figure 3.
The next step in the process is to convert the position of the line from the measurement system used in images (pixel units) to world units (feet/meters). Troy add calibration fiducials to the scene. The calibration fiducials are the large black dots to the left and right of the water tube. The scale between the left column of dots and the water tube is a section of scale typically used by the USGS to allow for visual water level checking in the wild. The dots were position at precise locations relative to the scale with the aid of a laser level. Next, an image of the scene is evaluated using blob analysis so their exact position is known in pixel units. The pixel to world coordinate conversion system can then be calculated because the pixel and world coordinate positions of each of the dots is now known. Figure 4. shows the system derived from the dots. The actual code for the pixel to world coordinate conversion model and its use in real world application will be the subject of a later article. A scale calculated from the model is shown as an overlay (in red) on the tube in Figure 1.
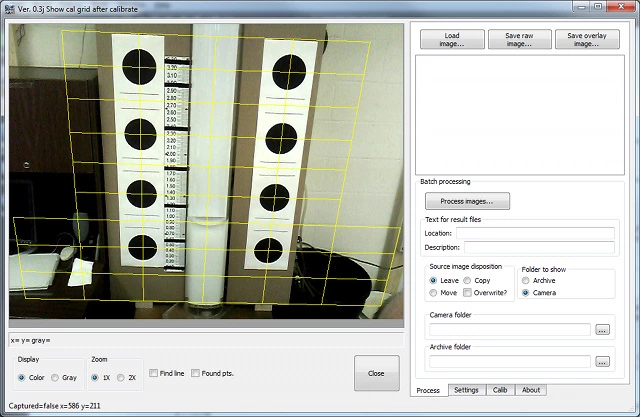
Figure 4.
Troy and his associates built infrastructure to capture images with as much variability as possible. They mounted the camera on a track that allowed it to be positioned from one to meters from the tube at different angles and elevations. A track to move a bright white light to a variety of positions and elevations was used to throw shadows and glints onto the scene. Troy systematically captured images and used the water level measurement and pixel to world coordinate conversion algorithms to calculate the accuracy and repeatability of the system.
The USGS wants measurements to a precision of +/- 0.01 feet. Of course, the ability to meet such a criteria, depends on how many pixels per inch are represented by a given field of view. A surprising result of the Phase Two investigation is that the water levels were often measured to within less than a pixel. What does that mean? If the field of view for the 640x480 image is four feet high, that means every vertical pixel in the image represents 0.0083 feet. An increase in the pixel resolution of the camera increases the precision of the system. For instance, The Imaging Source has a 1280x960 pixel resolution camera that would double the precision of the measurements from those made with a 640x480 pixel resolution camera. The camera-based water level measurement system easily met the criteria established for Phase II of the feasibility study.
Phase Three - A controlled field study
Permission was granted by NCSU and the City of Raleigh to install both calibration fiducials and a camera beside the USGS water level measurement station at the stream running through Pullen Park on the NCSU campus. Figure 5 is an image of the scene as it appears during the night with IR illumination.
Several weeks of work were required to acquire permissions, mount the camera, test the lighting and perform other setup chores. As for the results, Troy's blog notes after he accumulated the first comparison results are duplicated below with permission: Snapshot of GaugeCam and USGS Data - A Qualitative Comparison, Filed under Data, Image processing by Troy
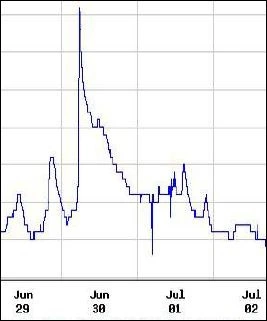
The Pullen Park hydrograph below is a snapshot of provisional data found on the USGS website.
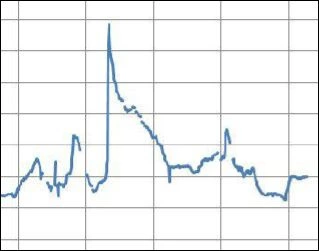
From a qualitative standpoint, we were pleased to find our data set mirrored the USGS data fairly well. We continue to investigate methods to minimize the gaps in data as well as measurement offsets compared to the USGS data. The GaugeCam hydrograph shape is shown below. One outlier was removed manually from the GaugeCam data set.
With the successful completion of the laboratory feasibility study, Dr. Birgand approved the release of additional funds to perform a larger field study to include an additional stream measurement study, coastal tide water level measurement, further data gathering with higher precision measurements at the Pullen, and additional controlled experiments in the BAE laboratory at NCSU.